

The $8 Power Supply That Cost $1,800
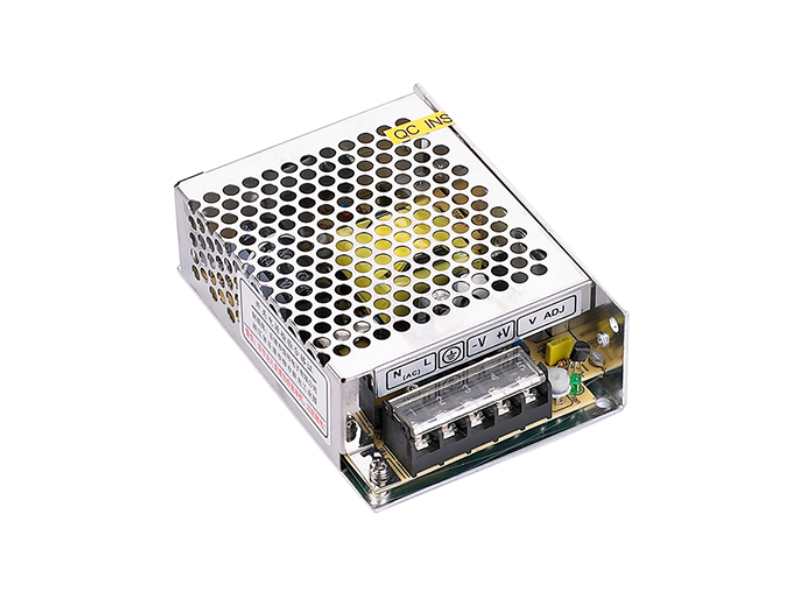
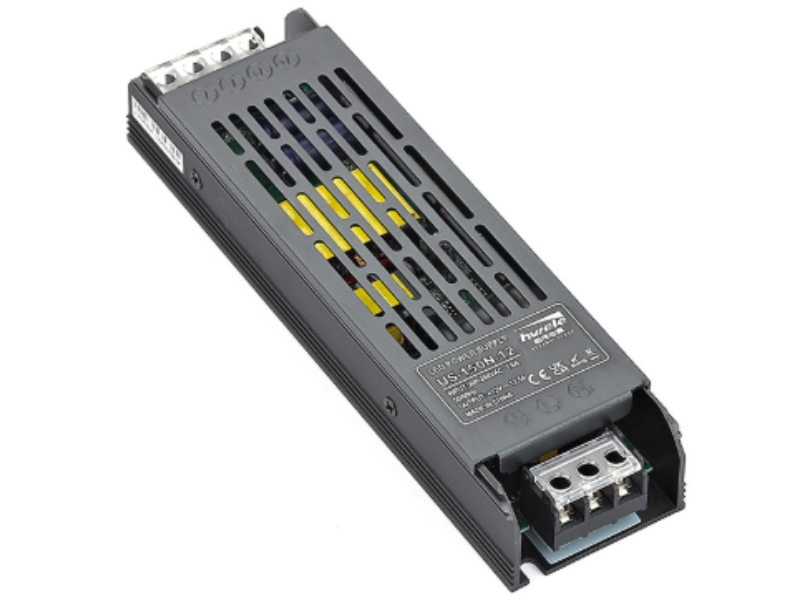
Walk into any industrial supply marketplace and you’ll see enclosed switching power supplies at wildly different price points. A 100W 24V unit might list for $8 from an unbranded supplier, $18 from a mid-tier brand, and $28 from a premium manufacturer like HWELE.
The instinct is universal: they all output 24V DC, why pay 3.5× more?
Here’s why. Over a 10-year operating life in a 24/7 industrial deployment, that $8 power supply will cost approximately $1,836 in total — when you account for electricity, replacement units, labor to swap them, and the cost of downtime. The $28 unit? $1,140. Same function. Same output. 38% less total cost — despite being 3.5× more expensive to buy.
This is Total Cost of Ownership (TCO) analysis, and it’s the single most underused tool in industrial procurement.
This article will teach you exactly how to calculate the real lifecycle cost of enclosed switching power supplies — from 10W DIN rail units powering a single sensor to 600W enclosures driving factory automation. We’ll give you the formula, three worked scenarios with real numbers, and a sensitivity model you can adapt to your own facility’s conditions.
Total Cost of Ownership (TCO) is a financial framework that calculates the complete cost of acquiring, operating, maintaining, and disposing of an asset over its entire useful life. The concept was popularized by Gartner in 1987 for IT procurement, but it applies with equal force to industrial power electronics.
For an enclosed switching power supply, TCO answers a single question:
The answer almost always favors the higher-quality unit — often by a margin that surprises even experienced engineers.
Research from the Institute for Supply Management (ISM) finds that acquisition cost represents only 20-40% of total lifecycle cost for industrial equipment. The remaining 60-80% hides in ongoing operational expenses. For switching power supplies — devices that consume electricity continuously for years — the gap is even wider.
| Cost Component | Typical Share of 10-Year TCO | Controllable at Procurement? |
|---|---|---|
| Purchase price | 5-15% | ✅ Yes — but least important |
| Energy consumption | 60-80% | ✅ Yes — via efficiency rating |
| Replacement & labor | 5-15% | ✅ Yes — via MTBF & reliability |
| Downtime | 5-20% | ✅ Partially — via MTBF |
| Disposal | < 1% | ❌ Minimal impact |
Every enclosed switching power supply generates costs across five categories. Here they are, ranked by their impact on the final TCO number:
Impact on 10-year TCO: 5-15%
| Unit price (per PSU) | $8 to $50+ depending on power rating, brand, and certification level |
| Quantity | Number of units in your deployment |
| Shipping & import duties | Typically 3-8% of unit cost for international procurement |
| Installation labor | $2-10 per unit (DIN rail clip-on; enclosed may require mounting + wiring) |
Impact on 10-year TCO: 60-80%
This is where TCO analysis earns its keep. A switching power supply is not 100% efficient — it wastes a percentage of input power as heat. That waste is electricity you pay for every hour, every day, for years.
Annual Energy Cost Formula
Annual Energy Cost ($) = Pout/η × Hoursyear × Rateelec ÷ 1000
Pout = rated output power (W) | η = efficiency (decimal, e.g. 0.90) | Rateelec = electricity price ($/kWh)
Let’s put real numbers behind this. A single 200W enclosed PSU running 24/7 at $0.12/kWh:
| Efficiency | Input Power | Annual kWh | Annual Energy Cost | 10-Year Energy Cost | vs. 93% Baseline |
|---|---|---|---|---|---|
| 85% | 235.3 W | 2,061 kWh | $247.32 | $2,473 | +$213 |
| 88% | 227.3 W | 1,991 kWh | $238.92 | $2,389 | +$129 |
| 90% | 222.2 W | 1,947 kWh | $233.60 | $2,336 | +$76 |
| 93% | 215.1 W | 1,884 kWh | $226.08 | $2,261 | Baseline |
Impact on 10-year TCO: 5-15%
Every power supply has a finite lifespan, measured by MTBF (Mean Time Between Failures). This number determines how many times you’ll replace the unit during your deployment window.
Expected Replacements Formula
Replacements = (Hourstotal ÷ MTBF) − 1 (round up to whole number)
Replacement Cost per Event = Replacement PSU price + Labor ($15-50/hr) + Shipping
| MTBF Rating | Expected Life (24/7) | Replacements in 10 Years | Total Replacement Cost (per unit) |
|---|---|---|---|
| 50,000 hours | 5.7 years | 1 replacement | $12 (unit) + $25 (labor) = $37 |
| 100,000 hours | 11.4 years | 0 replacements | $0 |
| 200,000+ hours | 22.8+ years | 0 replacements | $0 |
Impact on 10-year TCO: 5-20% (highly variable by industry)
When a power supply fails, the equipment it powers goes down. The cost of that outage depends entirely on what the equipment does:
| Application | Estimated Downtime Cost/Hour | What’s at Stake |
|---|---|---|
| CCTV / Security System | $50-200 | Coverage gap, liability, insurance implications |
| Factory Automation (PLC) | $500-5,000 | Production line stoppage, labor idle, missed deadlines |
| Medical Device Power | $10,000+ | Patient safety, regulatory compliance, liability |
| Data Center / Server Room | $5,000-9,000 | Service outage, SLA penalties, data integrity |
| LED Lighting (Commercial) | $10-50 | Tenant complaints, safety, emergency lighting code |
Sources: Pingdom/SolarWinds downtime survey; industry estimates; CIPS procurement benchmarks.
Impact on 10-year TCO: <1%
Switching power supplies contain electronic components (capacitors, semiconductors, PCB) that require proper e-waste disposal. In most regions, the cost is negligible ($0.50-2.00 per unit), but in jurisdictions with strict WEEE (Waste Electrical and Electronic Equipment) compliance, there may be documentation and tracking costs. Include a small disposal line item if your procurement policy requires it.
TCO = A + E + R + D − S
| A | Acquisition = (Unit price × Qty) + Shipping + Installation labor |
| E | Energy = (Pout / η) × Hoursyear × Years × Rateelec / 1000 |
| R | Replacement = Replacements × (Replacement PSU cost + Labor per swap) |
| D | Downtime = Failures × Hours outage per failure × Downtime cost per hour |
| S | Salvage = Residual or scrap value at end of life (typically $0 for PSUs) |
For analysis periods longer than 3 years, apply Net Present Value (NPV) to account for the time value of money:
Where r = discount rate (typically 5-10% for industrial capital, reflecting your organization’s cost of capital)
For a 10-year analysis at 7% discount rate, a $100 cost in year 10 has a present value of $50.83. Energy costs in later years matter less in today’s dollars — but they still matter.
Enough theory. Let’s calculate TCO for three actual deployment profiles. In each scenario, we compare a Budget PSU (lowest purchase price, basic specs) and a Premium PSU (higher purchase price, better efficiency and reliability — the kind HWELE manufactures).
| Cost Component | Budget PSU | Premium PSU | Premium Advantage |
|---|---|---|---|
| Specs | 85% eff. 50,000h MTBF $12/unit | 93% eff. 200,000h MTBF $28/unit | — |
| A — Acquisition | 50 × $12 + $200 shipping = $800 | 50 × $28 + $200 shipping = $1,600 | −$800 (premium costs more) |
| E — Energy 10yr, NPV-adjusted | 50 × $1,725 = $86,250 | 50 × $1,577 = $78,850 | +$7,400 |
| R — Replacement | 50 units × 1 swap × ($12 + $30 labor) = $2,100 | 0 replacements = $0 | +$2,100 |
| D — Downtime | 50 failures × 2hr × $500/hr = $50,000 | 0 failures = $0 | +$50,000 |
| TOTAL TCO (10 years) | $139,150 | $80,450 | $58,700 saved |
| Cost Component | Budget PSU | Premium PSU | Premium Advantage |
|---|---|---|---|
| Specs | 82% eff. 40,000h MTBF $8/unit | 90% eff. 150,000h MTBF $16/unit | — |
| A — Acquisition | 200 × $8 + $300 = $1,900 | 200 × $16 + $300 = $3,500 | −$1,600 |
| E — Energy (8yr) | 200 × $321 = $64,200 | 200 × $292 = $58,400 | +$5,800 |
| R — Replacement | 200 × 1 swap × ($8 + $25) = $6,600 | 0 replacements = $0 | +$6,600 |
| D — Downtime | 200 failures × 3hr × $30/hr = $18,000 | 0 failures = $0 | +$18,000 |
| TOTAL TCO (8 years) | $90,700 | $61,900 | $28,800 saved |
| Cost Component | Budget PSU | Premium PSU | Premium Advantage |
|---|---|---|---|
| Specs | 80% eff. 30,000h MTBF $6/unit | 89% eff. 150,000h MTBF $14/unit | — |
| A — Acquisition | 10 × $6 + $50 = $110 | 10 × $14 + $50 = $190 | −$80 |
| E — Energy (5yr) | 10 × $197 = $1,970 | 10 × $177 = $1,770 | +$200 |
| R — Replacement | 10 × 2 swaps × ($6 + $35) = $820 | 0 replacements = $0 | +$820 |
| D — Downtime | 20 failures × 4hr × $300/hr = $24,000 | 0 failures = $0 | +$24,000 |
| TOTAL TCO (5 years) | $26,900 | $1,960 | $24,940 saved |
The three scenarios above make one thing clear: efficiency is the single most important number on a PSU datasheet — far more important than the price tag. Here’s why the math is so brutal:
| PSU Power Rating | Hours/Year | Cost of +1% Efficiency (per unit/year) | Cost of 85%→93% Gap (per unit/year) | 10-Year Waste (per unit) |
|---|---|---|---|---|
| 30W | 8,760 (24/7) | $0.38 | $3.04 | $30 |
| 100W | 8,760 (24/7) | $1.27 | $10.16 | $102 |
| 200W | 8,760 (24/7) | $2.54 | $20.32 | $203 |
| 500W | 8,760 (24/7) | $6.35 | $50.80 | $508 |
| 600W | 8,760 (24/7) | $7.62 | $60.96 | $610 |
Assumptions: $0.12/kWh, 8,760 hours/year. Values are approximate and rounded.
TCO models rely on assumptions. A good procurement decision stress-tests those assumptions. Here are the key variables and how they affect the outcome:
| Variable | Base Assumption | Stress Test | Effect on Premium vs. Budget |
|---|---|---|---|
| Electricity price | $0.12/kWh | $0.18/kWh (+50%) | Premium advantage increases 50% — energy efficiency matters more when power is expensive |
| Deployment years | 10 years | 5 years | Premium advantage shrinks but stays positive — shorter horizon means fewer replacements, less energy accumulation |
| Actual MTBF (real-world) | As rated | 50% of rated (budget PSU in hot environment) | Premium advantage increases dramatically — budget PSU now fails 2-4× more often |
| Downtime cost | $500/hr (factory) | $2,000/hr (critical line) | Premium advantage increases 4× — critical applications should never consider budget PSUs |
| Discount rate | 7% | 12% | Premium advantage shrinks slightly — higher discount rate reduces present value of future energy savings |
Beyond the five standard TCO components, there are hidden cost drivers that catch even experienced procurement professionals off guard:

You don’t need expensive software. A well-structured Excel or Google Sheets workbook can handle TCO analysis for any PSU procurement. Here’s the template:
| Tab | Contents |
|---|---|
| 1. Inputs | Deployment parameters: quantity, power rating, hours/year, electricity rate, analysis period, discount rate, MTBF, efficiency, unit price, labor rate, downtime cost/hr |
| 2. Vendor A | Full TCO calculation for first supplier: Acquisition + Energy (year-by-year with NPV) + Replacements + Downtime = Total |
| 3. Vendor B | Same structure as Vendor A, with different input values |
| 4. Comparison | Side-by-side summary: total TCO, cost breakdown chart, NPV comparison, break-even year |
| 5. Sensitivity | Toggle cells for electricity price, deployment years, MTBF multiplier — TCO auto-updates |
At HWELE, we engineer every enclosed switching power supply with TCO in mind — because we know our customers don’t buy a power supply once. They pay for it every month on their electricity bill.
| Product Line | Power Range | Typical Efficiency | MTBF | Certifications |
|---|---|---|---|---|
| Enclosed Switching PSU | 10W – 600W | 88% – 93% | 200,000h+ | CE, KC, 3C, UL, ISO 9001 |
| DIN Rail PSU (NDR) | 10W – 480W | 89% – 93% | 200,000h+ | CE, KC, UL |
What HWELE provides that supports your TCO calculation:
For 24/7 industrial deployments over 10 years, the purchase price typically represents only 5-15% of total lifecycle cost. Energy consumption dominates at 60-80%, with replacement labor and downtime making up the remainder.
Use the formula: Annual Cost = (Rated Power / Efficiency) × Operating Hours × Electricity Rate / 1000. For a 200W PSU at 90% efficiency running 24/7 at $0.12/kWh: (200/0.90) × 8760 × 0.12 / 1000 = $233.60/year.
MTBF (Mean Time Between Failures) is a statistical prediction, not a guarantee. It means that in a large population of identical units operating under specified conditions, the average time between failures will approximate the MTBF value. Individual units can fail much earlier or much later. Always ask if the MTBF rating is verified at your actual operating temperature.
Almost always yes for any deployment running more than 12 hours/day. For a 200W PSU at $0.12/kWh, the 5% efficiency gap costs $26.28/year in extra electricity. Over 10 years: $263. If the premium PSU costs $10 more, you’re getting a 26× return on that difference — and that’s before accounting for the premium unit’s likely better reliability.
Calculate expected replacements as (Total Operating Hours / MTBF) − 1, rounded up. Multiply by (replacement PSU cost + labor hours × hourly rate). For a technician at $30/hr spending 45 minutes per swap, labor per replacement is approximately $25-35 on top of the PSU cost.
TCO, always. Cost per watt ($/W) only reflects purchase price divided by power rating — it ignores efficiency, reliability, and operating costs entirely. Two PSUs with identical $/W can have wildly different 10-year TCO. Use $/W only as a quick filter, never as a final decision metric.
Use your current commercial/industrial rate as the base, then run a sensitivity with +30% and +50% scenarios. Industrial electricity prices in most markets have trended upward over the past decade (2-4% annual increase in many regions), so a flat-rate assumption is optimistic. If you’re in the EU, factor in potential carbon pricing impacts.
Higher ambient temperatures reduce both efficiency and MTBF. A PSU operating at 55°C instead of 25°C can lose 2-3% efficiency and have its MTBF cut by 30-50%. Always use derated efficiency and MTBF values for the actual installation environment. A PSU spec’d at 25°C that’s installed in an unventilated cabinet is not the same PSU.
For most small-to-medium commercial users, no — residential and small commercial meters bill on real power (kW), not apparent power (kVA). However, large industrial users may face reactive power penalties if their facility PF drops below 0.90-0.95. If you’re deploying hundreds of PSUs in an industrial facility, include PF penalty estimates in your TCO. See our Active PFC guide for details.
Yes. Contact our engineering team with your deployment parameters (quantity, power rating, hours/year, electricity rate, expected ambient temperature, and analysis period) and we’ll provide a custom TCO comparison using our third-party verified test data. This is a free service for qualified project inquiries. Request a TCO analysis here.
Contact HWELE for a free, no-obligation TCO analysis tailored to your deployment. We’ll run the numbers with our verified efficiency and MTBF data — so you can make the decision with confidence, not guesswork.
Email: [email protected] | Web: www.hwele.net
ISO 9001 • ISO 14001 • CE • KC • 3C • UL Certified • 20+ Years of Power Supply Excellence
Related Technical Resources from HWELE:
Demystifying Active PFC: Why PF > 0.95 Matters | Managing THD in High-Density LED Driver Deployments | HWELE Enclosed Switching Power Supply Product Line
© 2026 HWELE (Hengwei). All rights reserved. | TCO methodology adapted from Gartner TCO framework and ISM procurement best practices.


 Optimized by Seraphinite Accelerator